


|
|
|||||||||||||||||||||||||||
| |||||||||||||||||||||||||||
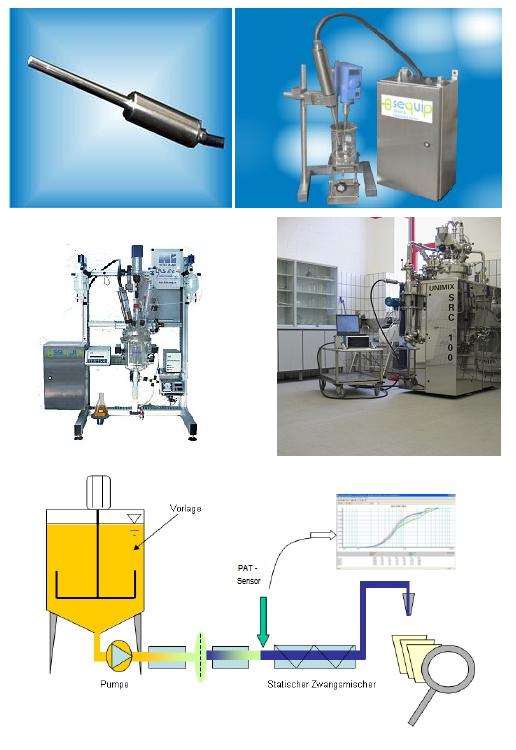
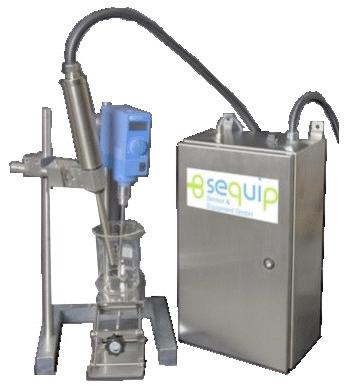
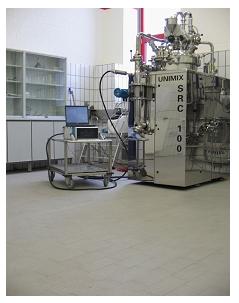
공장용 실시간 영상 모니터링 기술을 2010년 12월 부터 MCIK를 통해 구현하실수 있게 되셨습니다. Insitu Particle Analysis Technology (PAT)! Continuous information on size progression within the development process of droplets, particles and crystals, undiluted insitu measurement in high concentrations Insitu PAT-Sensors for detection of particulate Changes under process conditions - Highest selectivity and sensitivity under original production conditions - Optimisation of quality and purity of solids - Increase of productivity with the formulation of new products - Increase of production safety - High saving of time wihtin product development - Production quality control 24h/365 days a year - Ex-protection versions for operational application 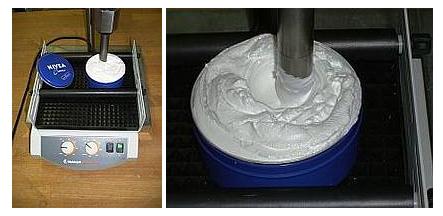 The Insitu PAT-Sensor is placed in the product, this may be within a laboratory beaker or directly within a supply line in pilot plant stations or process. The PAT-Sensor System ist started and the distribution is presented on screen within seconds. Changes during measurment phases are continuously displayed. The data are displayed as trend graph over time. Changes in production process can be detected at once and appropriate action can be taken accordingly. The Insitu PAT-Sensor Systems provide the opportunity to transmit data digitally and/or analogically. Possible measuring ranges <0.5 to 4000 µm
Volume concentration in Vol% Measurement of < 5% Particle Distributions 5 -> 40% Particle System Distributions above 60% Fingerprints
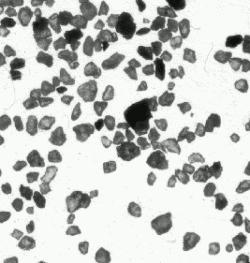
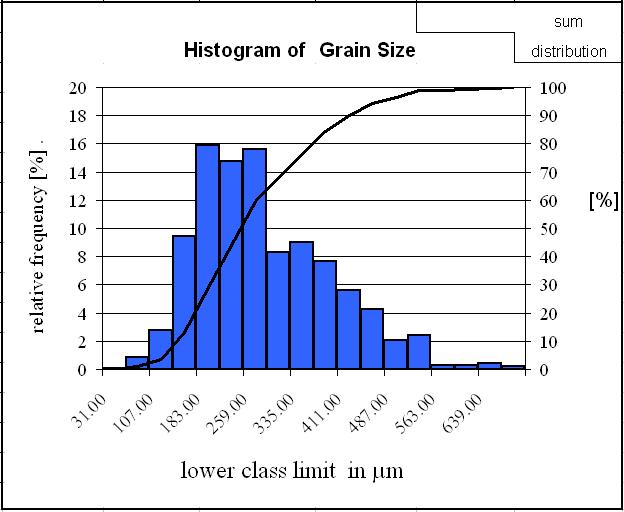
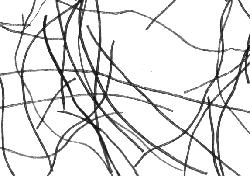
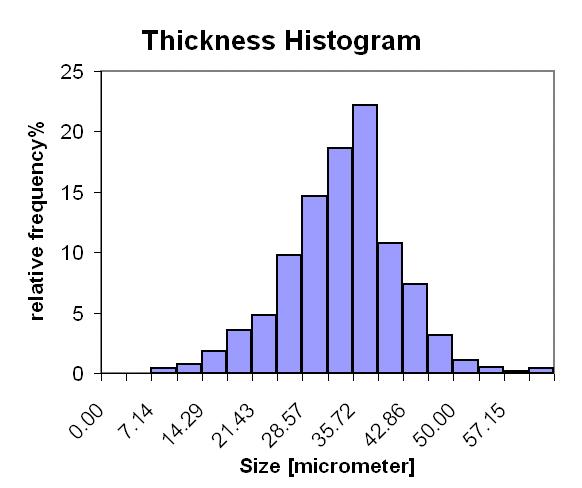
Fiber shape analyzers 섬유소 형상 분석기 - 연구용 및 공정용 Do you need a high aspect ratio capable particle sizer? Powdershape is a characterisation system for powders and generally all kinds of particles especially developed for quality inspection. It is unique in its set of features, simple user interface, and rapid characterisation process from the sample preparation to the printed certificate. Two kind of Powdershape systems exist: · Powdershape - where the samples are distributed stepwise by hand on the scanner · Powdershape automatic - where the samples are feeded automatically by the sample feeder on the scanner. (sample feeder: patent pending). Sand sample. (B) Fibreshape Looking for a tester or quality control solution for wood, natural or man-made fibres? Fibreshape is a quality control and characterisation system for fibre applications. It is unique in its set of features, simple user interface, and rapid characterisation process, from the sample preparation to the printed certificate. Two kind of Fibreshape systems exist: · Fibreshape - where the samples are distributed stepwise by hand on the scanner · Fibreshape automatic - where the samples are feeded automatically by the sample feeder on the scanner. (sample feeder: patent pending). Wool standard sample. (3) 독일 Dataphysics사 MultiScan MS-20 measuring Instrument for Particle and Stability Characterization 분산 및 유화 안정성 측정기 New innovative particle and droplet sizer in multiphase system 유화 안정성 분산 물질의 Stability, Shelf-life 등을 측정하는 신개념 장비 MS-20 MultiScan Ms20 은 희석하지 않은 고농도 Liquid Dispersion의 Homogeneity 와 분산안정성을 연구하는데 이용되는 분산 상태를 나타내는 절대값을 구하는 신개념의 장비 입니다. 이 절대값은 분석하고자 하는 시료의 분산 상태를 나타내는 "Fingerprint"로 1) Microstructure에 의존하며 (Flocs, Gels 등) 2) Particle Size에 의존하며 3) 농도(Volume Fraction)에 의존하며 4) Absorption (입자에 의한 빛의 흡수)에 의존하며 5) Non-absorbing한 시료의 경우 평균 입경을 계산하는데 이용 되는 유체의 분산성 연구에 사용되는 강력한 분석 도구 입니다. (4) HAAKE 광학 레오미터 모듈 RheoScope 을 이용하는 방법: 유변 물성 측정기와 정밀 광학 현미경을 함께 결합시킨 Thermo 의 최첨단 기술력을 바탕으로 개발된 광학 레오미터 입니다. 불가능햇던 어려운 과제 였었습니다. 시료의 미세 구조 변화를 유발하는 전단력 (Shear) 의 영향의 올바른 분석 을 위해서는 ◊전단력 (Shear) 영향 아래 놓인 시료중 입자 동역학의 정량적 고찰 Module 로 간단하게 고찰 될 수 있다. 하지만 일반 레오미터로 구해지는 본 시료에 대한 점도 변화 곡선의 고찰 만으로는 시간의 경과에 따른 점도 감소 거동이 시료의 특별한 pc™ Film Thickness Analyzer (5) Zeta Potential & Particle Size Analysis with Real Time Observation 신개념 실시간 영상 분석을 통한 입도 및 제타 포텐셜 변화 측정 장치 - Characterization of particles and dispersion stability of colloidal systems 입자의 Zeta potential이 높을수록 분산도가 좋아지고 Zeta potential이 "0" 에 가까와 질수록 입자간의 인력이 높아져서 Cluster 가 생성되어 분산성이 저하 됩니다. - New "ZEECOM" ZC-3000 의 특징 1. CCD 카메라를 사용하여 LCD화면에서 자동으로 여러개의 입자의 크기와 이동 방향 및 속도를 확인하면서 입도 및 Electric mobility 결정 과정 확인 가능. 2. Laser를 사용하여 20 nm 입자까지 측정이 가능. 3. LCD 모니터를 통해 직접 확인하며 측정하기 때문에 비극성 용매등의 효과로 유발되는 예상치 못한 측정 장애 요소 극복이 가능. 4. Laser Doppler나 PALS 및 초음파를 이용한 측정 장치를 이용한 방법은 시험기기 내부에서 일어나는 이상 현상을 전혀 감지할수 없기에 소프트웨어에 표시되는 결과를 그냥 인정 해야만했던 (Black box 내부에서와 같이 시험중 어떤 현상이 일어나는지 확인할 방법이 없었음) 기존 시험 방법의 어려움을 극복 하실수 있습니다. Zeta Potential & Particle Size Analysis with ZEECOM Technology
|
|||||||||||||||||||||||||||||||||||||||||||||||||||||


|
